Key Takeaways
- Every rupee sitting in unsold stock on your shelves is a rupee not working for your business.
- Spreadsheets rely on static snapshots and manual work, which leads to data lag and overordering.
- AI demand forecasting recalculates reorder points and quantities automatically as transactions happen.
- Track metrics like dead stock %, stockout frequency, and reorder accuracy weekly to prevent cash lockups.
- Build a weekly stock review and monthly planning rhythm to eliminate dead stock before it accumulates.
Rs 3.2 L
average annual dead stock loss per mid-size Indian store
28%
of SMB retailers report overordering as their top problem
40%
dead stock reduction with AI demand forecasting
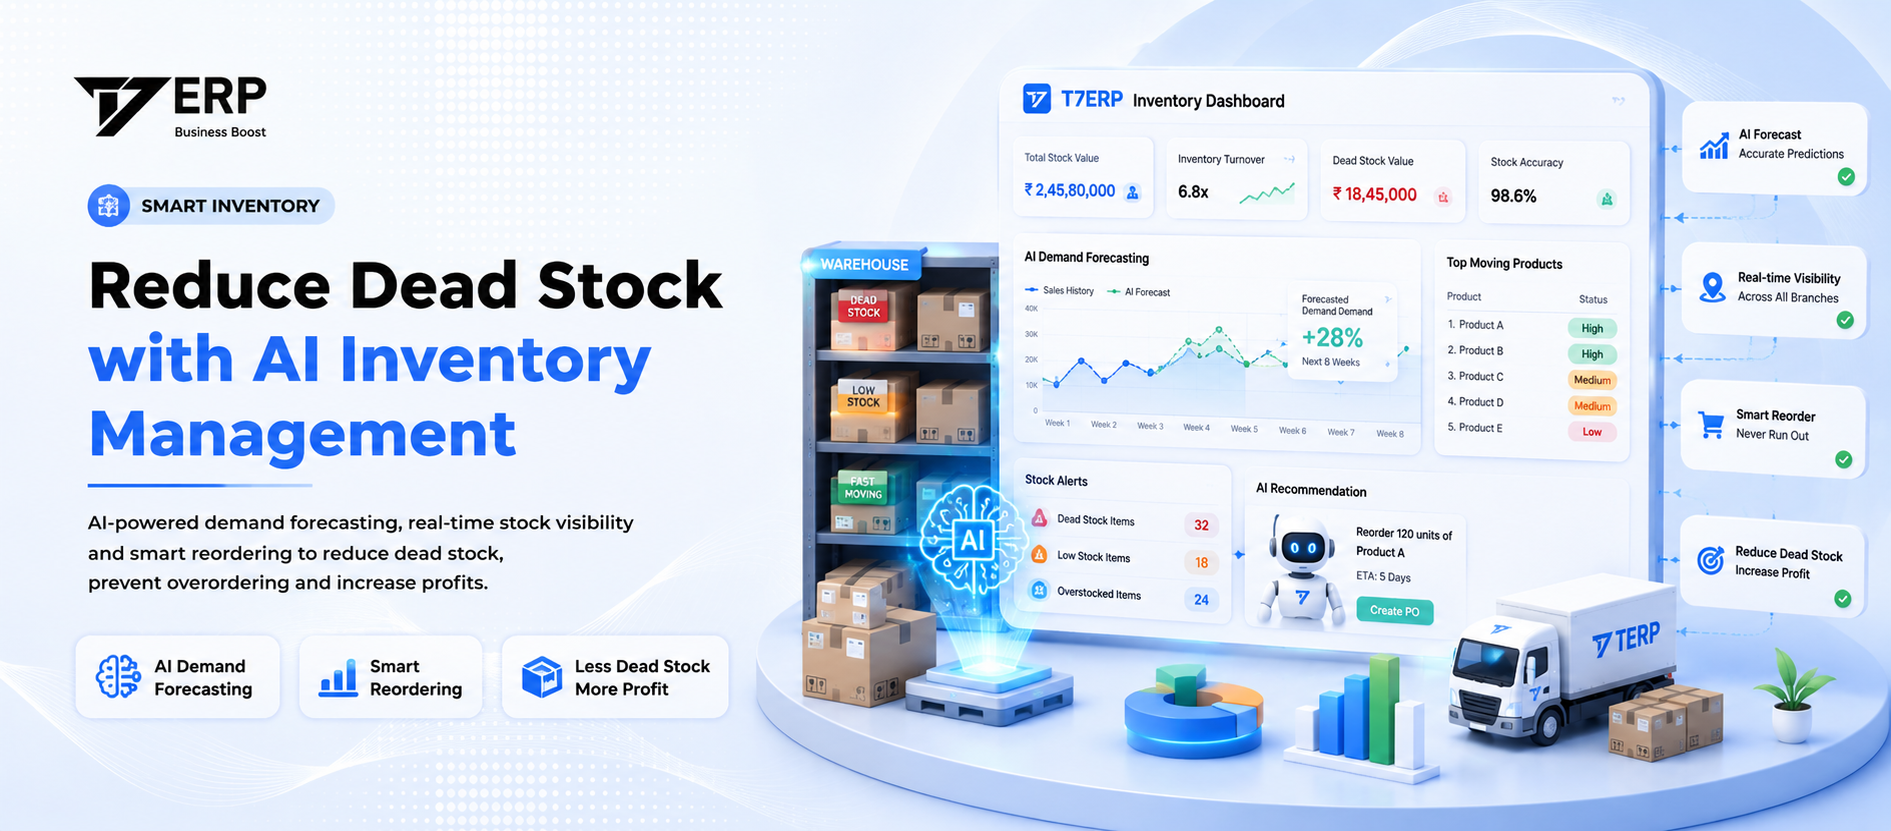
Every rupee sitting in unsold stock on your shelves is a rupee not working for your business.
01Why dead stock happens (and it's not what you think)
Most retailers blame wrong buying decisions for dead stock. The real cause is almost always a data lag problem.
Your supplier's minimum order quantity was 50 units. Your last sale of that item was 6 months ago. Nobody flagged it because your purchase team checks the warehouse physically, not a system. By the time you notice, you have Rs 80,000 of slow-moving stock tying up shelf space and working capital.
The three root causes in Indian retail:
- •Festive season overbuying — Diwali, Holi, and back-to-school orders are placed on gut feel, not on SKU-level sell-through data from the previous year.
- •No lead-time visibility — When your supplier lead time is 3 weeks, you order early and over-order to be safe. Without a system flagging current stock levels, you double-up.
- •Disconnected billing and inventory — If your POS billing software and your purchase register are not the same system, your stock numbers are never accurate in real time.
02How AI demand forecasting works (in plain language)
You do not need a data scientist. You need a billing and inventory system that tracks sales at the SKU level and uses that data to suggest reorder quantities.
Here is what AI demand forecasting actually does:
- 4Reads your historical sales data — by SKU, by week, by month, by season.
- 5Identifies patterns: which items spike before Diwali, which slow down in summer, which follow a steady weekly rhythm.
- 6Factors in lead time: if your supplier takes 10 days to deliver, the system works backward from your projected stockout date.
- 7Recommends a reorder quantity and reorder point — not a gut-feel number but one derived from your actual sales velocity.
The difference between this and a spreadsheet is that the AI recalculates every time new sales data comes in. A spreadsheet is a static snapshot. Your sales velocity changes daily.
Comparison
Manual Spreadsheets vs AI Demand Forecasting
| Dimension | Manual Spreadsheet | AI Forecasting (Recommended) |
|---|---|---|
| Data freshness | Weekly / monthly | Real-time |
| Effort required | High | Very low |
| Forecast accuracy | Low–Medium | High |
| Dead stock risk | High | Low |
AI forecasting reduces dead stock risk by up to 40%
03Real numbers: how one retailer reduced dead stock by 40%
A garment retailer in Pune with 3 branches and roughly Rs 1.2 crore in annual inventory spend had a recurring problem. Every season, 18–22% of purchased stock did not sell through before the next season. They were marking down goods at 30–40% discounts each time — eating into margins every quarter.
After switching to an AI-driven inventory system, here is what changed in one financial year:
- •SKU-level sell-through visibility — they could see exactly which sizes and colours moved and which did not, by branch.
- •Festive season forecast — instead of ordering the same quantities as the previous year, the system recommended quantities based on 3 years of sales data weighted by recent velocity.
- •Automated low-stock alerts — they stopped running out of fast-moving SKUs while simultaneously over-stocking slow ones.
| Metric | Before AI System | After AI System | Improvement |
|---|---|---|---|
| Dead stock percentage | ~20% of inventory | ~12% of inventory | 40% reduction |
| Seasonal write-offs | Rs 3.8 lakh | < Rs 2 lakh | Rs 1.8 lakh saved |
04The metrics that actually tell you if inventory is under control
Most retailers track total stock value. That number alone tells you nothing useful.
Track these five instead, weekly:
- 8Stock turn rate — how many times your inventory sells through in a year. Below 4× for FMCG or 2× for apparel is a warning sign.
- 9Dead stock percentage — stock that has not moved in 90+ days as a share of total inventory.
- 10Stockout frequency — how often a customer asks for a product you do not have.
- 11Reorder accuracy — what percentage of purchase orders were within 10% of actual demand.
- 12Supplier fill rate — what percentage of your orders your supplier fulfilled on time and in full.
Key Metrics
5 Inventory Metrics Every Retailer Must Track
4–8×
Stock turn rate
Monthly<10%
Dead stock %
Weekly<2%
Stockout freq
Weekly>85%
Reorder accuracy
Monthly>90%
Supplier fill rate
Per orderBenchmarks for Indian retail — FMCG and apparel may differ
05Why your current software might be making things worse
This is the conversation nobody wants to have. But if you are running inventory on Tally or Excel and billing on a separate POS, your stock data is always wrong by the time you look at it.
Signs your current setup is creating inventory problems:
- •Your warehouse staff do a physical count because they do not trust the system numbers.
- •You have to reconcile purchase invoices manually at month end.
- •Your billing team and purchase team use different files or registers for the same products.
- •You cannot see branch-wise stock levels without calling the branch.
- •Your reorder decisions are based on experience, not data.
T7 ERP connects billing, inventory, purchase orders, and GST in one system — so when a sale is billed at the POS, stock levels update instantly, and the reorder engine has accurate data to work with. There is no reconciliation step because the data was never separated in the first place.
06Seasonal and festive inventory planning: an Indian retail framework
Indian retail has predictable demand cycles that most inventory software built for Western markets does not account for. Diwali, Eid, Holi, back-to-school, wedding season, and financial year-end all create distinct demand spikes that need to be baked into your reorder planning.
Planning Framework
Festive Season Planning Timeline
12 weeks before — Review past performance
Review last year's SKU sell-through
8 weeks before — Place initial orders
Order fast-movers; hold 20-30% budget
4 weeks before — Review early signals
Track pre-season sales demand shifts
2 weeks before — Top-up stock
Order fast-moving replenishment items only
During season — Track daily metrics
Promote slow items below 15% sell-through
Post-season — Record learnings
Log results as AI model training data
Applies to Diwali, Eid, Holi, back-to-school, wedding season
07Building an inventory operating rhythm that prevents dead stock
Dead stock is not a one-time problem you solve. It is a habit problem you manage with a consistent weekly and monthly routine.
Rhythm Cycle
Monthly Inventory Operating Rhythm
- •Run a slow-mover report (0 sales in 30 days)
- •Check dead stock % against 10% benchmark
- •Flag overstocked items for promotion or return
- •Check reorder alerts from inventory system
- •Confirm supplier lead times before ordering
- •Hold reorders for items with 30+ days of cover
- •Match goods received against purchase orders
- •Update quantity or price variances in system
- •Review supplier fill rate for past 4 weeks
- •Pull stock turn rate and dead stock %
- •Review next 4-6 weeks for seasonal signals
- •Share brief reports with purchase & sales teams
Takes 30–45 min/week with an integrated inventory system
T7 ERP generates the slow-mover report, reorder alerts, and supplier fill rate data automatically — so this rhythm takes 30–45 minutes a week rather than half a day.
Common mistakes Indian retailers and distributors should stop making
How T7 ERP helps
T7 ERP helps Indian retailers manage GST billing, POS, inventory, accounting, purchase records, and reconciliation workflows in one connected system. It reduces manual billing errors, keeps invoice data structured, and gives teams cleaner records before return filing.
Want T7 ERP to handle this automatically?
Auto GSTR-1, GSTR-2B reconciliation, e-Invoice, and e-Way Bill in one platform built for Indian retailers.
Conclusion
Dead stock is not an inventory problem — it is a visibility problem. The retailers who eliminate it are not smarter buyers; they are looking at better data more frequently. AI demand forecasting takes the effort out of that process and turns historical sales into forward-looking reorder decisions.
Getting your inventory management right frees up working capital, reduces the markdown pressure that squeezes margins, and gives you the headroom to grow without adding complexity.
If you want to see how this works in practice for your store or distribution business, T7 ERP offers a free demo — bring your current inventory challenge and walk through a live workflow.
Priya Nambiar
Inventory & Operations Consultant · T7 ERP
Priya has 11 years of experience working with Indian retailers, FMCG distributors, and multi-branch operators on inventory optimisation, ERP implementation, and supply chain simplification. She has helped over 150 businesses reduce dead stock and build sustainable reorder systems.
Related Articles
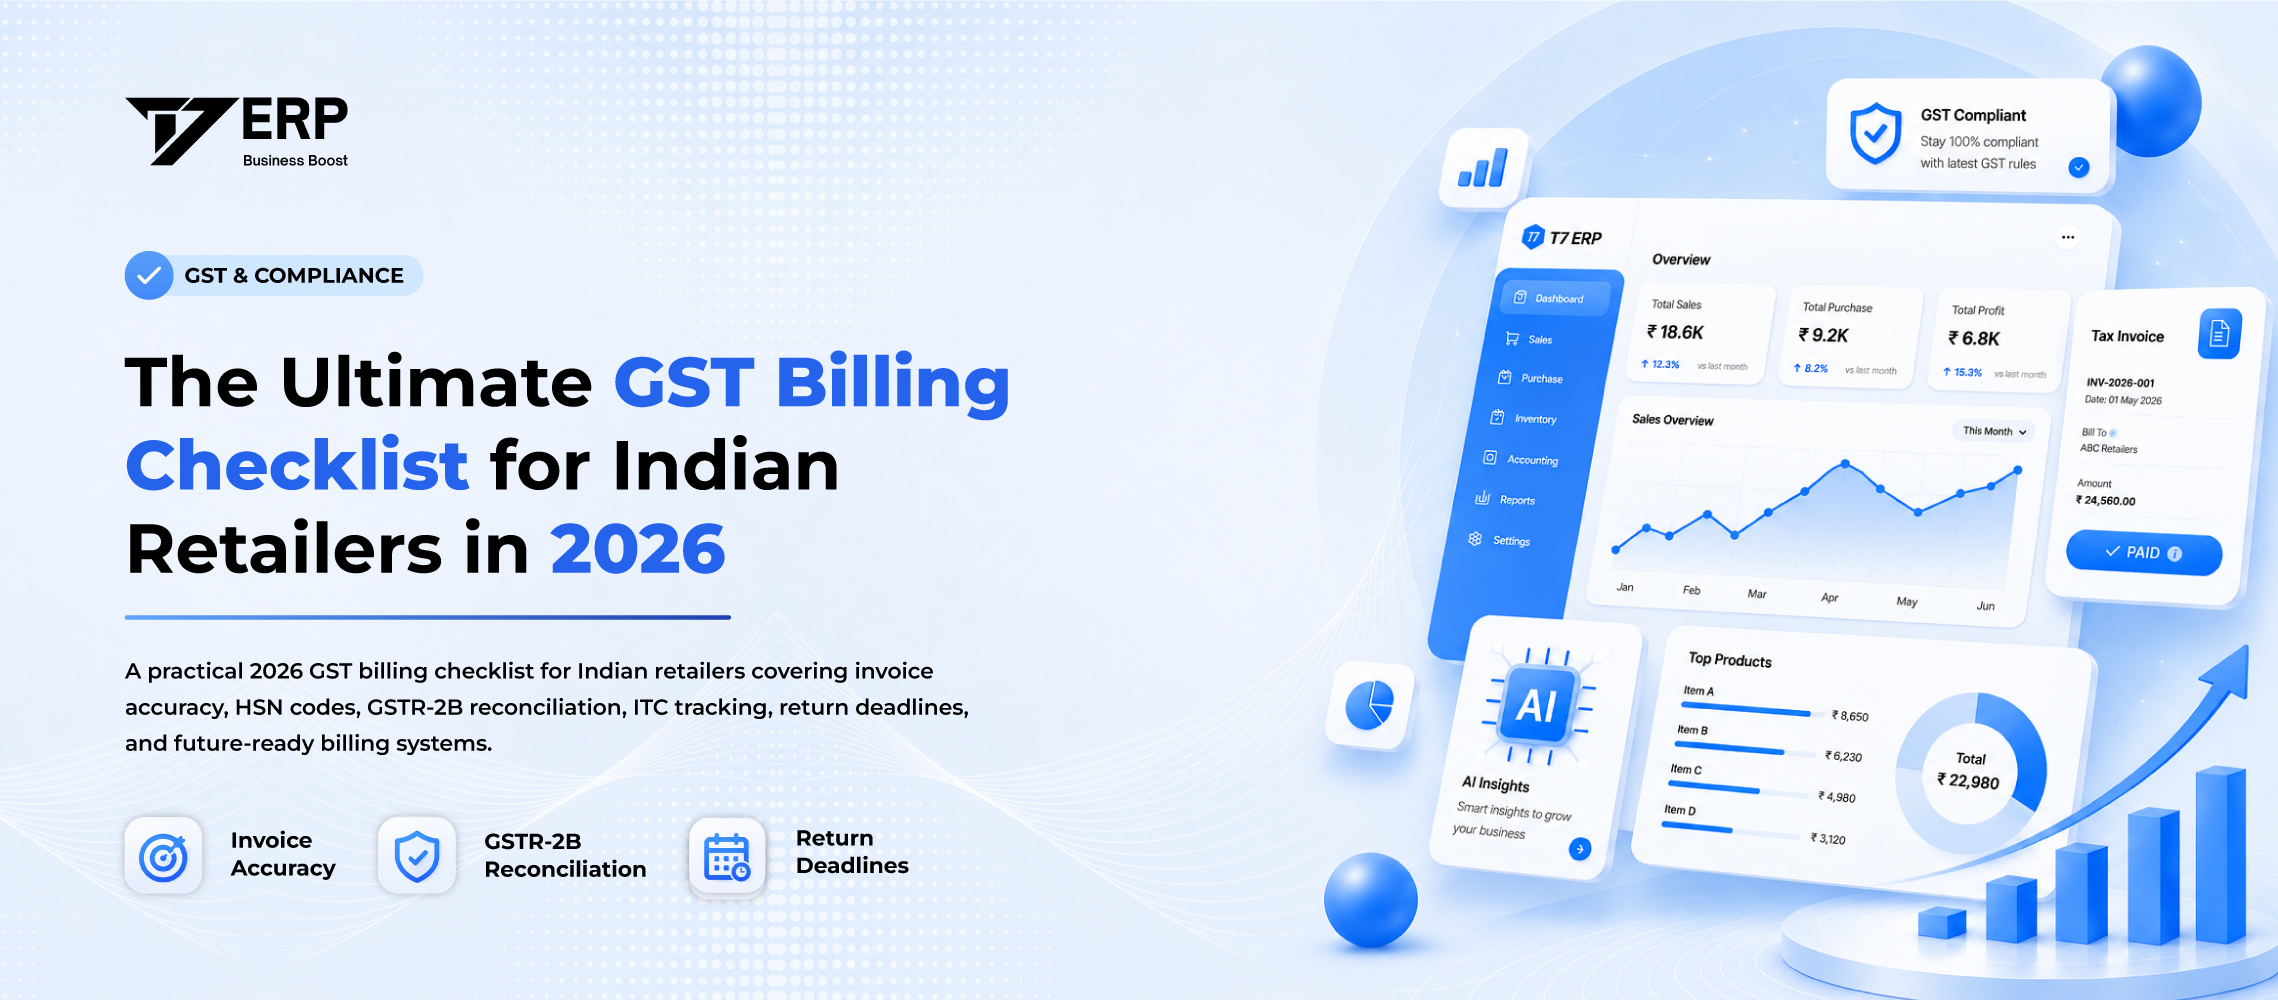
The Ultimate GST Billing Checklist for Indian Retailers in 2026
12 min read
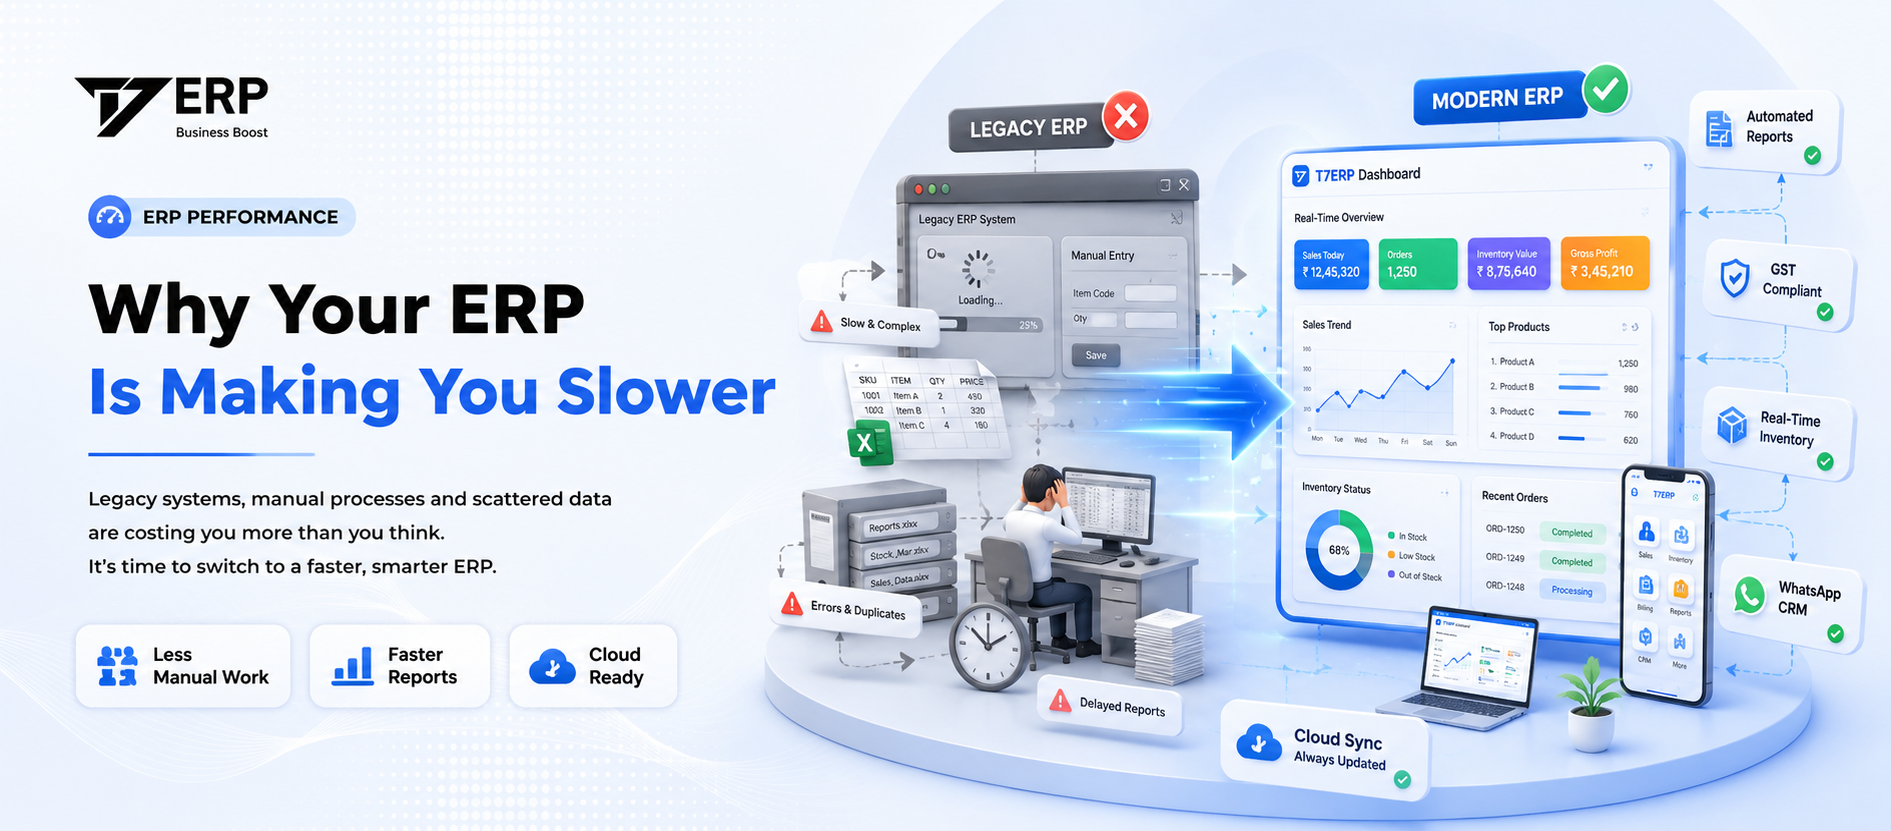
Why Your ERP Is Making You Slower (And What to Do About It)
7 min read

WhatsApp for Business: How Indian Retailers Are Using It to Sell More
7 min read
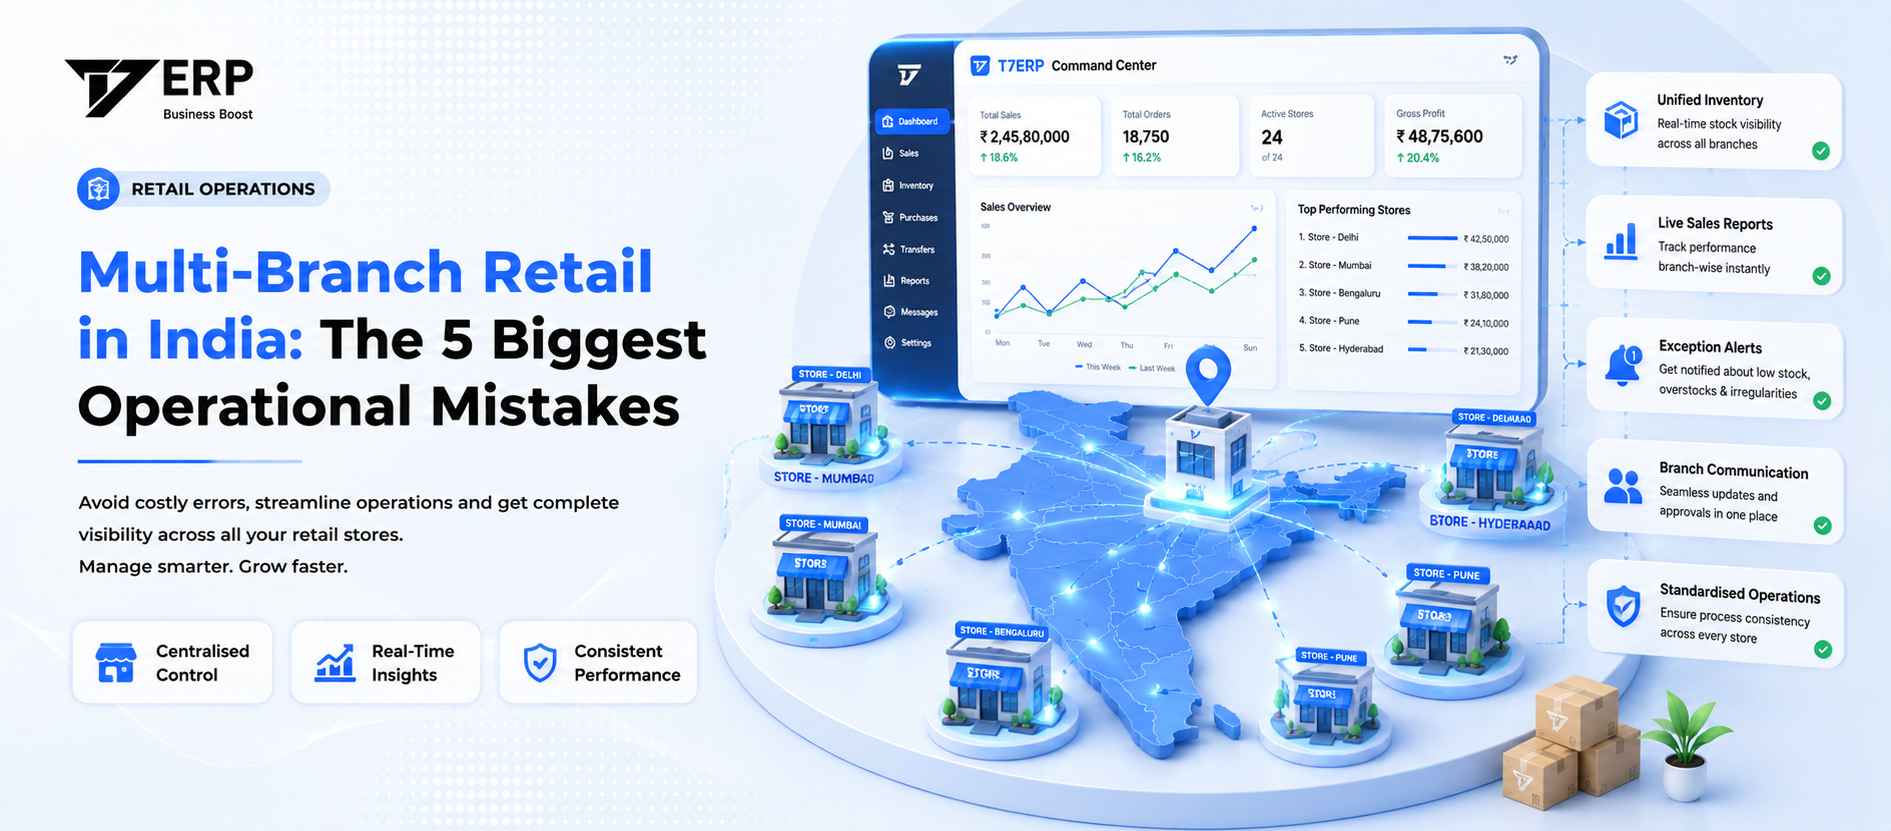
Multi-Branch Retail in India: The 5 Biggest Operational Mistakes
7 min read